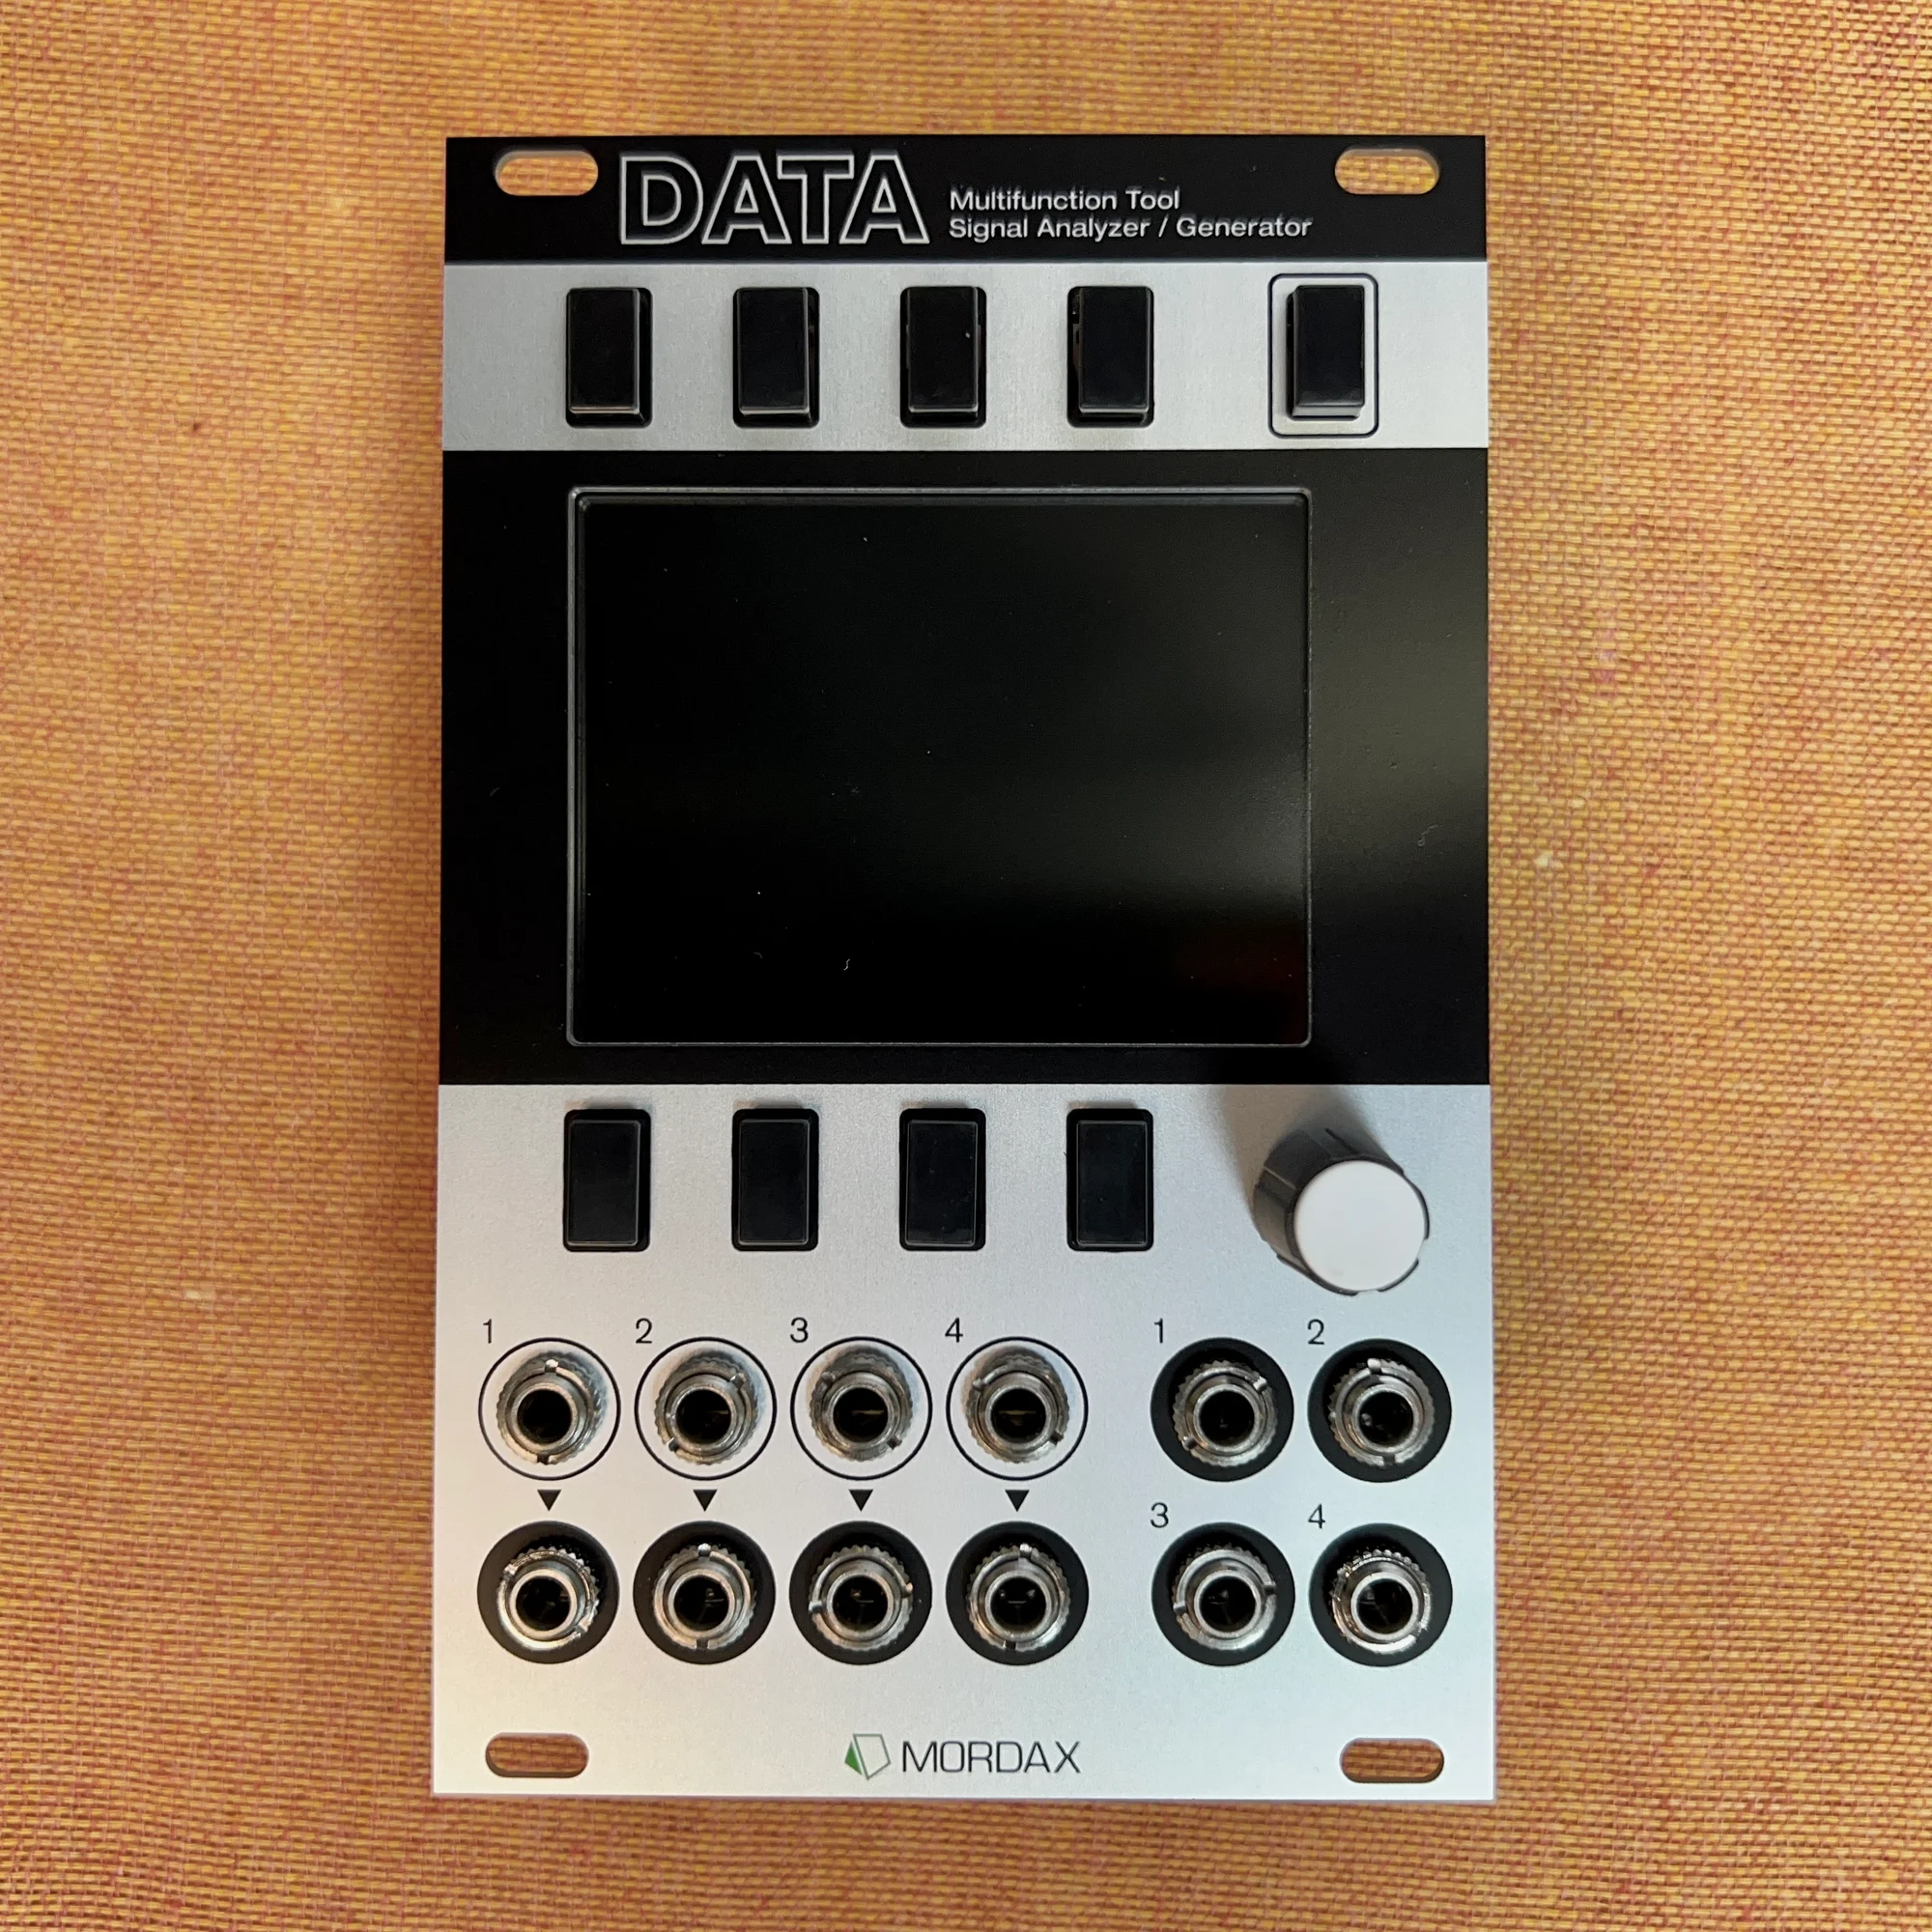
This is EP.1 of the Mordax DATA guide series. This time, we'll go through the big picture of the module and then work our way through the oscilloscope program, DATA's central feature.
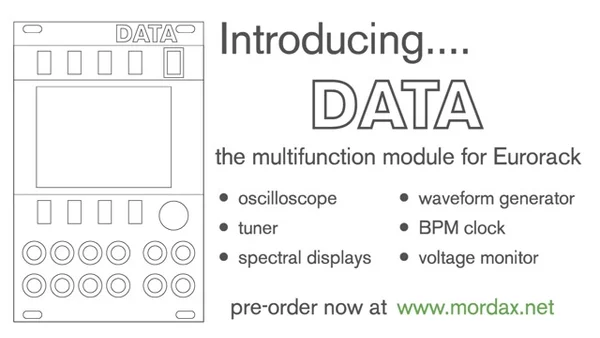
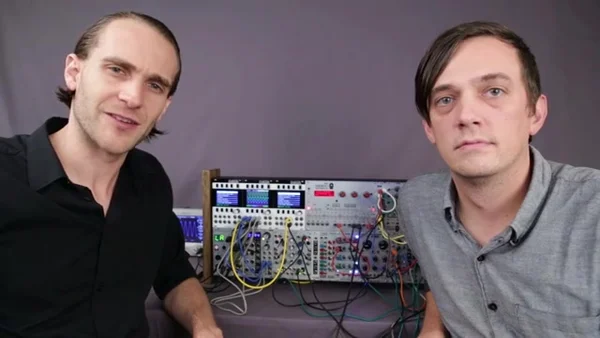
The Mordax DATA is a 16HP multifunction module that packs six programs into a single unit: an oscilloscope, a spectrum analyzer & spectrograph, a tuner, a waveform generator, a clock, and a voltage monitor. It has a 2.8-inch full-color display, and each of its four inputs comes with a buffered thru output, so you can send whatever you patch into DATA straight on to another module without any signal loss. The firmware can be updated by the user from the included microSD card, so features keep getting added and improved over time.
Takazudo Modular publishes manuals and related documents with Japanese translations. See the links below.
The demo video in this article was published in 2015, before the DATA's production firmware shipped, so it shows a prototype. Here's what was added or changed on the current firmware (SYS V01.02.05), plus a couple of things the video doesn't get into.
Secondary top menu functions: press and hold the Menu Button — the top-rightmost button on the unit — for about 1.5 seconds to reach the oscilloscope program's secondary top menu functions. Press and hold again to return to the primary top menu; a quick press and release takes you to the system main menu instead. The two features below live here
XY Scope: it takes a pair of inputs and plots one amplitude on the X axis and the other on the Y. The pairs are either CH1(X) & CH2(Y) or CH3(X) & CH4(Y). The XY SCOPE button in the secondary top menu opens a pop-up where you can turn its visibility on and off, choose the channel pair (SOURCE), and offset its position (OFFSET). Visibility is independent from the source channels, but scale and position are linked to them
Minimal Display Mode (MIN-MODE): a mode that turns off the scope's grid and control buttons so you see nothing but the channel waveforms and the XY display. Toggle it with the MIN-MODE button at the top left of the secondary top menu. While MIN-MODE is on, every soft button stops working except the MIN-MODE button itself, shown as a small grey circle at the top left of the screen
AUTO and NORM trigger modes (this article covers only the trigger source, LEVEL, and EDGE): DATA's oscilloscope has two trigger modes, AUTO (automatic trigger) and NORM (normal trigger). AUTO triggers at a fixed rate based on the currently selected time scale, while NORM only generates a trigger event when the signal crosses the trigger level — if it never does, the screen stops updating. The manual recommends NORM for repeating audio-rate waveforms (time scale of 10ms or less), AUTO for slower or non-repeating signals (time scale typically 10ms or more), and always AUTO when the time scale is set to large values
Ch2 and Ch3 display colors: these were slightly adjusted for better visibility in SYS V01.02.04 (April 26, 2022), so the colors in this article's video captures may not match what a current unit shows
The official manual, linked just above, covers all of these in detail.
- What Is the Mordax DATA
- Oscilloscope Basics
- Four-Channel Display (Scale and Position)
- AC / DC Coupling
- Triggering (Level and Edge)
- Time Scale (Horizontal Axis)
- RUN / STOP
- Measuring with Cursors
- Visualizing a CV / Audio Pathway Across Four Channels
What Is the Mordax DATA
DATA is a module that combines measurement tools for "seeing" the voltages inside your Eurorack system with generators for producing signals. In a modular system where multiple oscillators, envelopes, and CV are all tangled together, being able to grasp how the voltage is actually moving at each point takes you a long way in building patches, debugging them, and understanding how a new module behaves.
The six programs on board DATA are selected by turning the encoder from the main menu and launching them with a push. In EP.1, we'll be looking at the most central one of the bunch: the oscilloscope program.
Oscilloscope Basics
An oscilloscope is a measurement instrument that displays voltage amplitude against time as a 2D graph. Amplitude runs along the vertical axis (Y) and time along the horizontal axis (X), letting you visually read a waveform's shape, size, and period. You can use it for all sorts of things when it comes to understanding how a modular system behaves — checking the shape of an envelope, or observing phenomena like frequency modulation and phase cancellation.
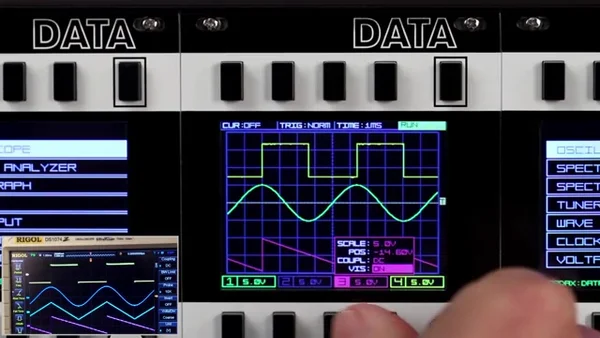
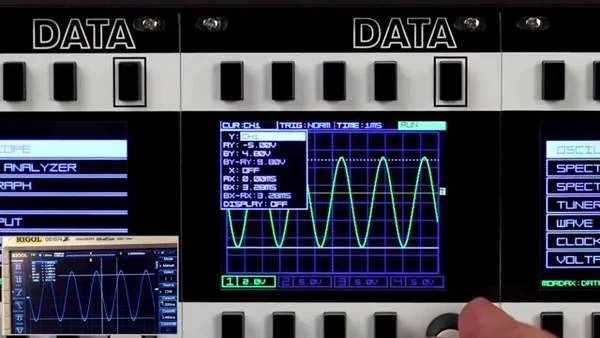
DATA's oscilloscope was designed with the goal of recreating the functionality of a stationary bench scope. In the demo video, the same signal DATA is displaying is also shown on the screen of a bench scope (a Rigol DS1074Z), with the two placed side by side for comparison. The input used is an oscillator waveform from an Intellijel Dixie 2.
Four-Channel Display (Scale and Position)
DATA's oscilloscope can display four input channels simultaneously. Each channel can be shown or hidden individually, and the vertical scale (volts per division) and position (vertical placement on screen) can be controlled independently per channel.
Changing the scale gives you the equivalent of zooming the waveform in and out. For example, if you change the scale on just channel 1's sine wave, only that channel's waveform gets displayed larger on screen. The grid's Y axis is made up of 8 divisions, so at a scale of 5.0V per division, the full screen is showing a 40V range.
AC / DC Coupling
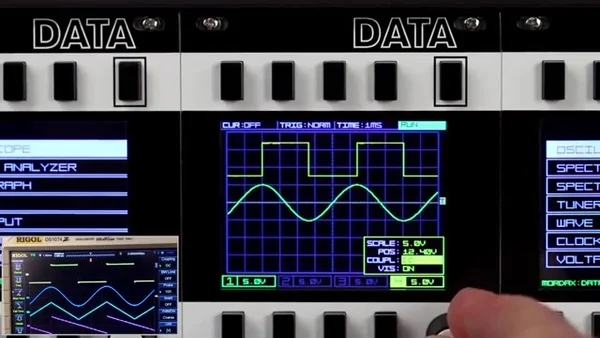
Each channel has a setting to switch between AC and DC coupling. Choosing AC coupling inserts a DC blocking capacitor (0.47uF) in series with the channel input, cutting the DC component so that only the AC component passes through.
For instance, if you feed in a steady 5V CV signal with AC coupling, its DC component gets blocked, so it shows up on screen as 0V. DC coupling is the default for normal signal observation, but AC coupling comes in handy when you want to isolate and observe just the AC component.
Triggering (Level and Edge)
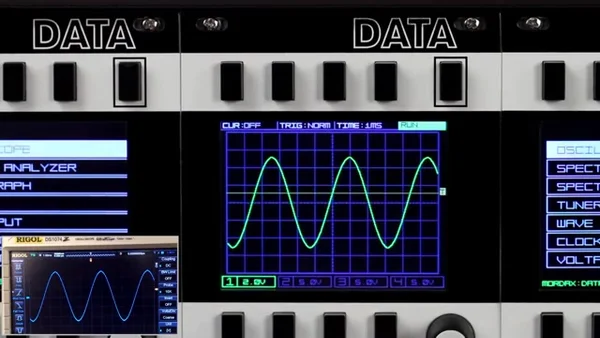
To display a repeating waveform stably, the trigger settings matter. DATA's oscilloscope can use any of the four input channels as its trigger source, and you can specify the voltage level at which the trigger fires (LEVEL) and whether it fires on the signal's rising edge (RISE) or falling edge (FALL) (EDGE).
Changing the trigger level moves the display's reference position up and down, and switching the edge from RISE to FALL makes the waveform look like it has shifted left or right. That's because the position on screen the waveform is drawn relative to has changed.
Time Scale (Horizontal Axis)
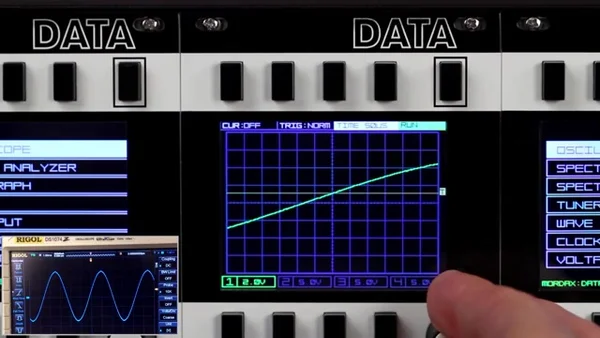
The resolution of the horizontal axis is set with the time scale. The setting range runs from 50uS (microseconds) to 5.0S (seconds) per division, and the grid's X axis is made up of 12 divisions. Set it to 1MS (1 millisecond) per division, for example, and the full screen is showing 12 milliseconds' worth of signal.
Dialing the time scale down lets you observe high-frequency waveforms in fine detail; dialing it up lets you capture the overall shape of slow signals like an LFO.
RUN / STOP
Pressing the RUN/STOP button pauses and resumes waveform capture. Freezing the display lets you take your time examining the waveform you caught at that moment.
Measuring with Cursors
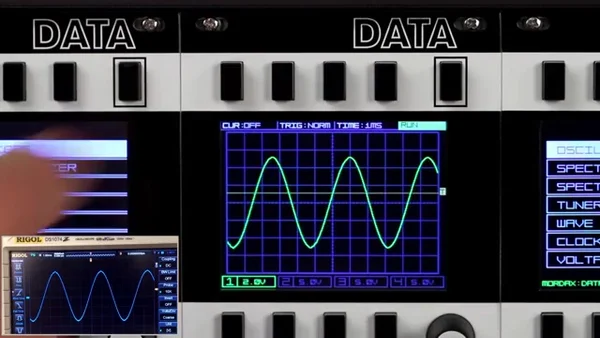
Beyond just reading rough values off the grid divisions, DATA's oscilloscope has a cursor feature for precise measurement. You get two cursors per axis — the Y-axis cursors measure voltage, and the X-axis cursors measure time.
The gap between the two cursors (the delta) is displayed beneath each control, with the voltage difference or time difference between A and B calculated automatically. Turning the cursors' DISPLAY on keeps the cursor positions and delta values on screen even after you close the popup menu and move into a different submenu.
Visualizing a CV / Audio Pathway Across Four Channels
With a four-channel oscilloscope, you can lay out the process of a single sound being made and observe it component by component. In the demo video, the following signal path is displayed across four channels at once:
Channel: the square wave from an Intellijel Dixie 2 (the VCO output)
A Make Noise Maths AD envelope providing CV control over that VCO's pitch
The other Maths AD envelope controlling the oscillator's volume via a VCA
The VCA output that ultimately reaches your ears (the last channel)
Set the trigger source to the envelope on channel 2 and switch the edge from RISE to FALL, and the waveform shifts just like it does on the bench scope. You can also see the square wave's frequency climbing as the envelope's voltage rises, right there in the changing waveform.
When the channel 3 envelope controlling the VCA is a straight (flat) line, no volume modulation is being applied and the oscillator just keeps sounding at a constant level. Add a curve to that envelope and you can watch the amplitude of channel 4's final waveform get shaped to follow the envelope's contour. In other words, you can follow the relationship — channel 3's lead line shaping channel 4's waveform — all on one screen.
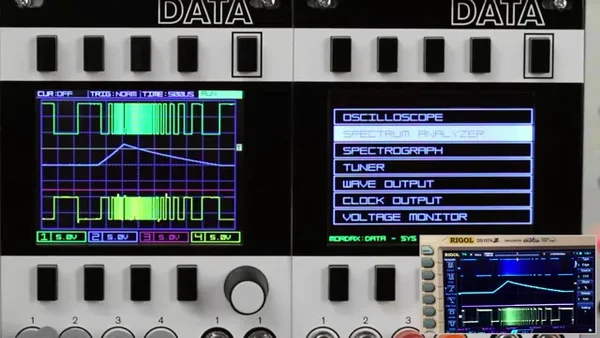
Being able to see the waveform, the pitch control, the volume control, and the final audio all lined up at once makes the four-channel oscilloscope an effective way to understand how a module behaves and how CV control works within a system.
That's it for EP.1. This time we covered the big picture of the Mordax DATA and its oscilloscope program, which recreates a bench scope. We went through the basic operations for seeing voltage with your own eyes — channel display, AC/DC coupling, triggering, time scale, cursor measurement, and visualizing a CV pathway using all four channels. Next time, in EP.2, we'll cover the tuner, which measures the frequency of an input signal, and the spectrum analyzer & spectrograph, which display harmonic content.
Note that the demo video referenced in this article is Mordax Systems' official demo video. Be sure to watch the video to see how the screen actually moves.
Mordax DATA Product Details
You can find the product details for the Mordax DATA below.
A 16HP multi-purpose utility combining an oscilloscope, spectrum analyzer, tuner, and voltage monitor, plus a 2-voice digital oscillator and clock generator. Helps you debug patches and understand how voltages behave at a glance. Black panel version.
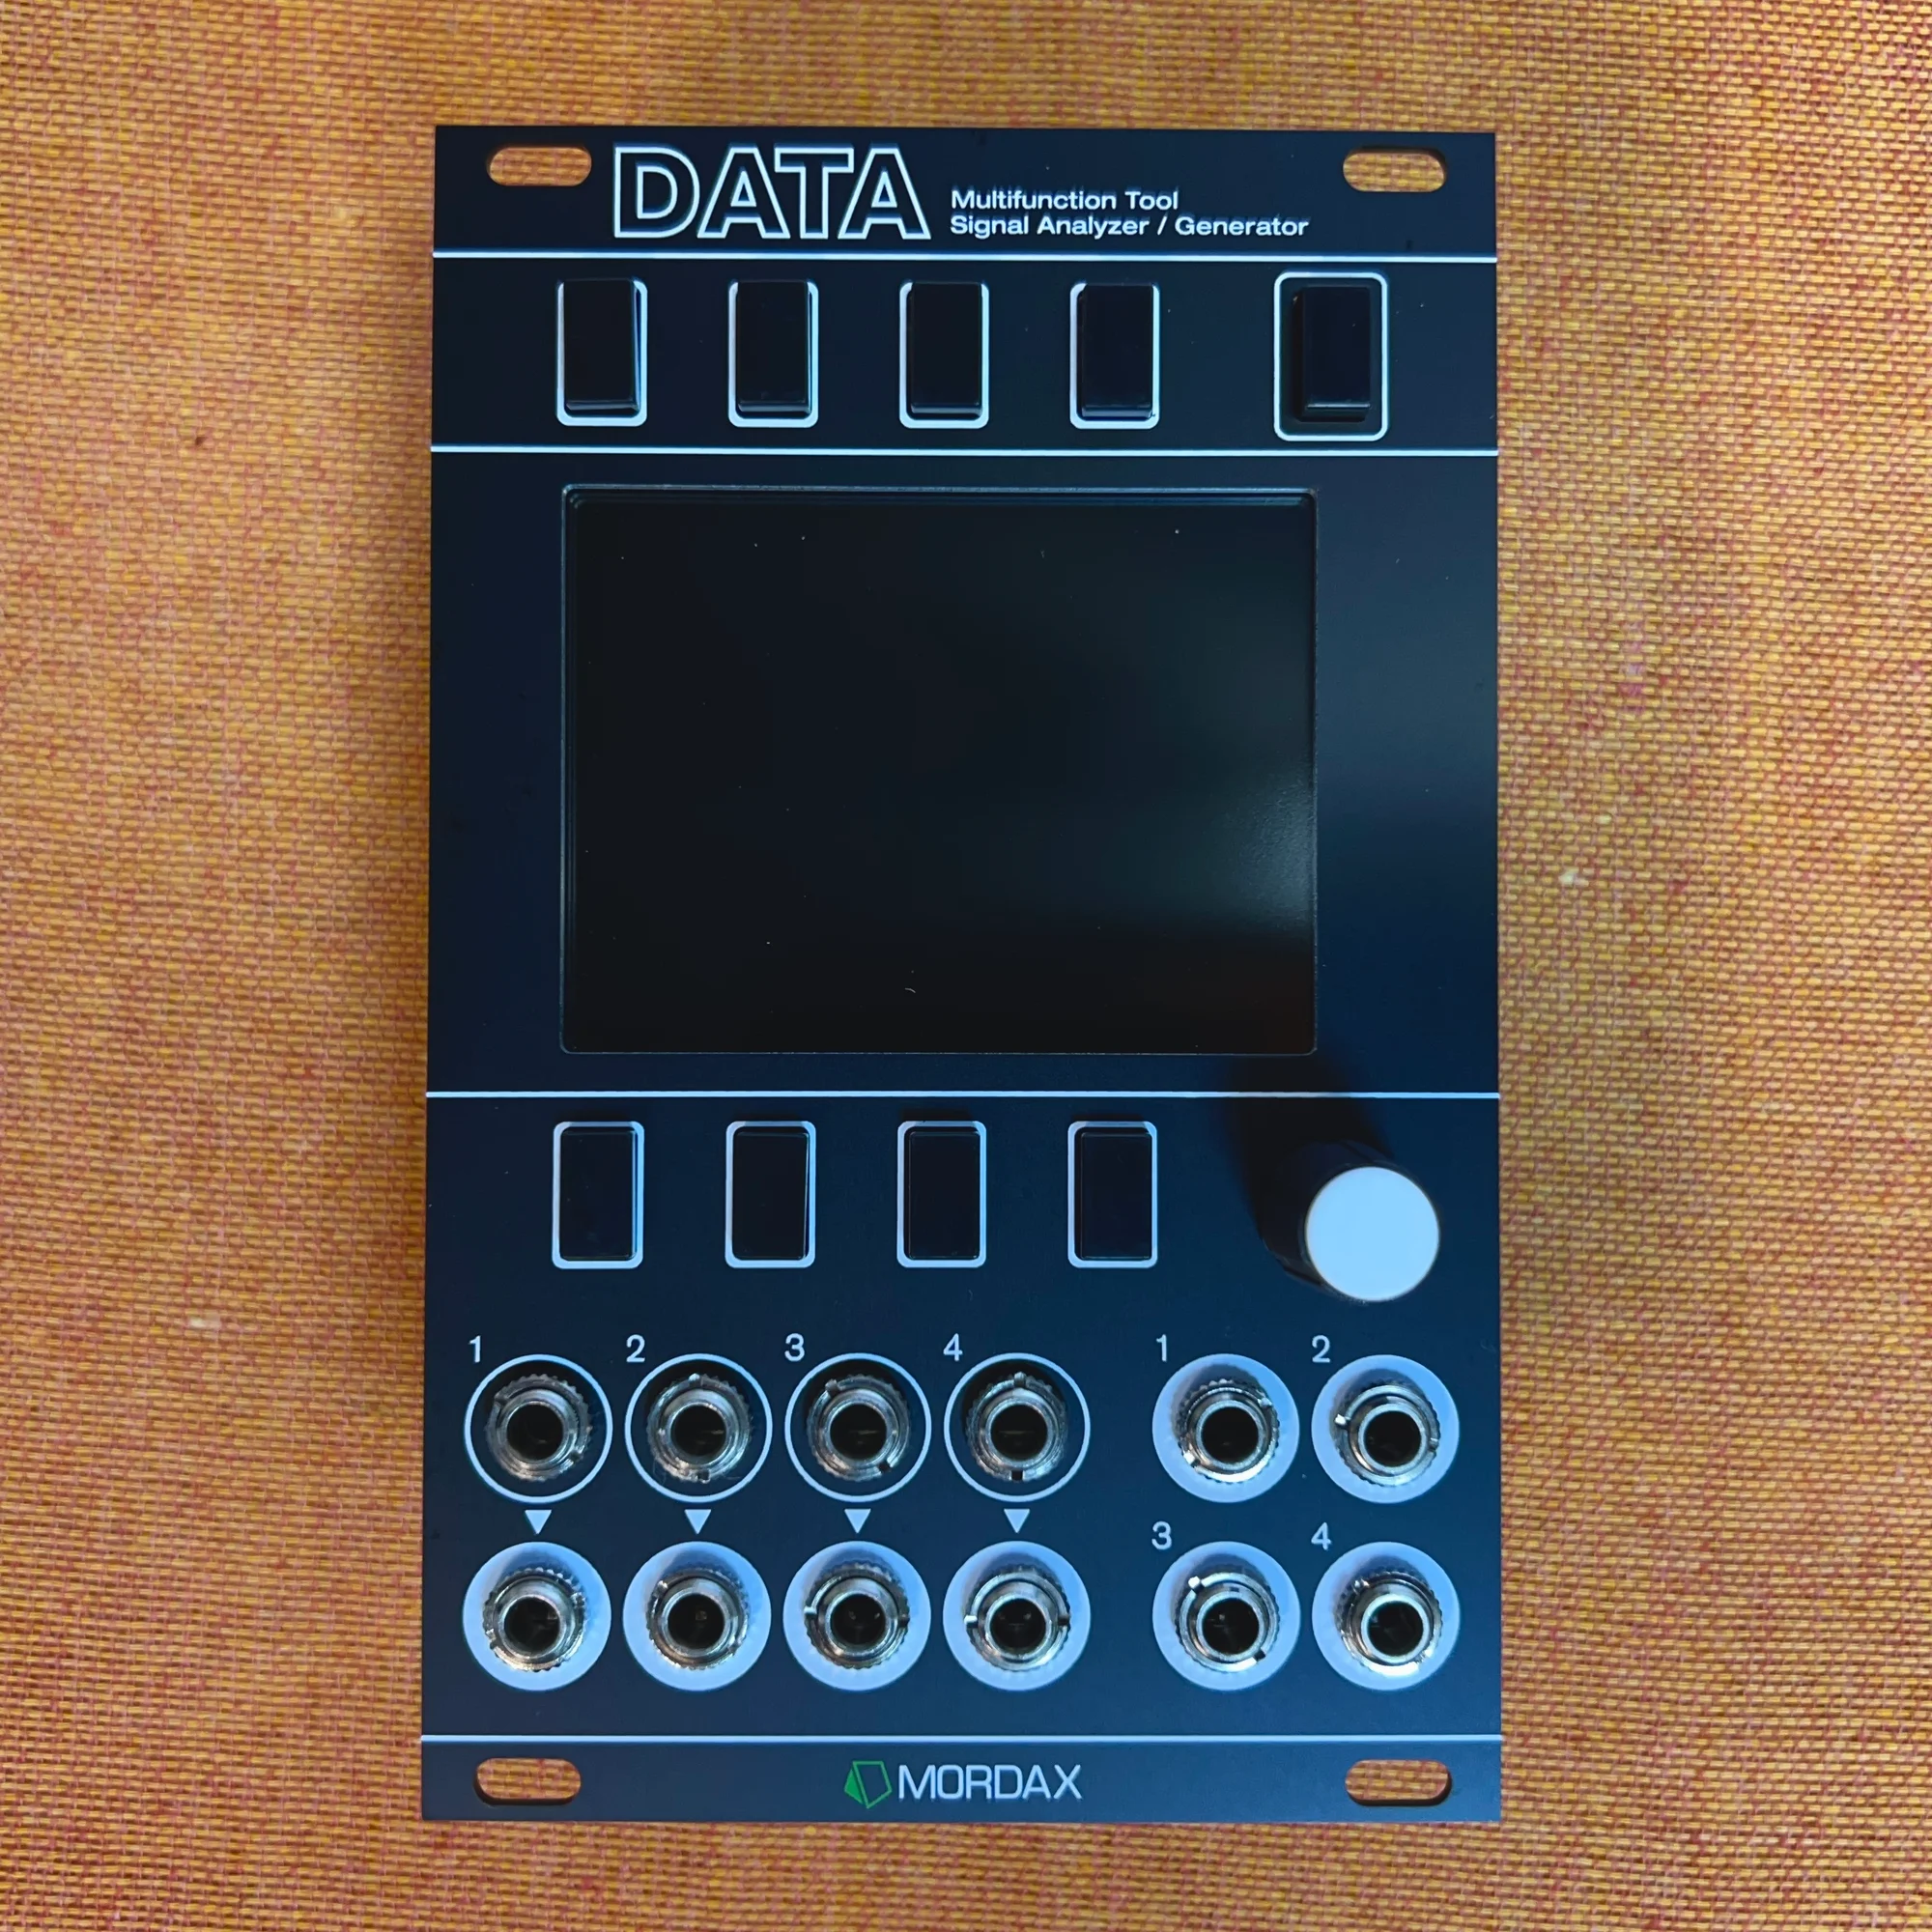
A 16HP multi-purpose utility combining an oscilloscope, spectrum analyzer, tuner, and voltage monitor, plus a 2-voice digital oscillator and clock generator. Helps you debug patches and understand how voltages behave at a glance. Silver panel version.